We’ve watched the pattern repeat inside professional kitchens for years, and a strong recipe template is often what keeps development costs from drifting into production. When volume and weight align inside a well-built recipe template, consistency improves, execution gets easier, and food cost percentage stays better protected.
TL;DR Quick Answers
Dry spice yields
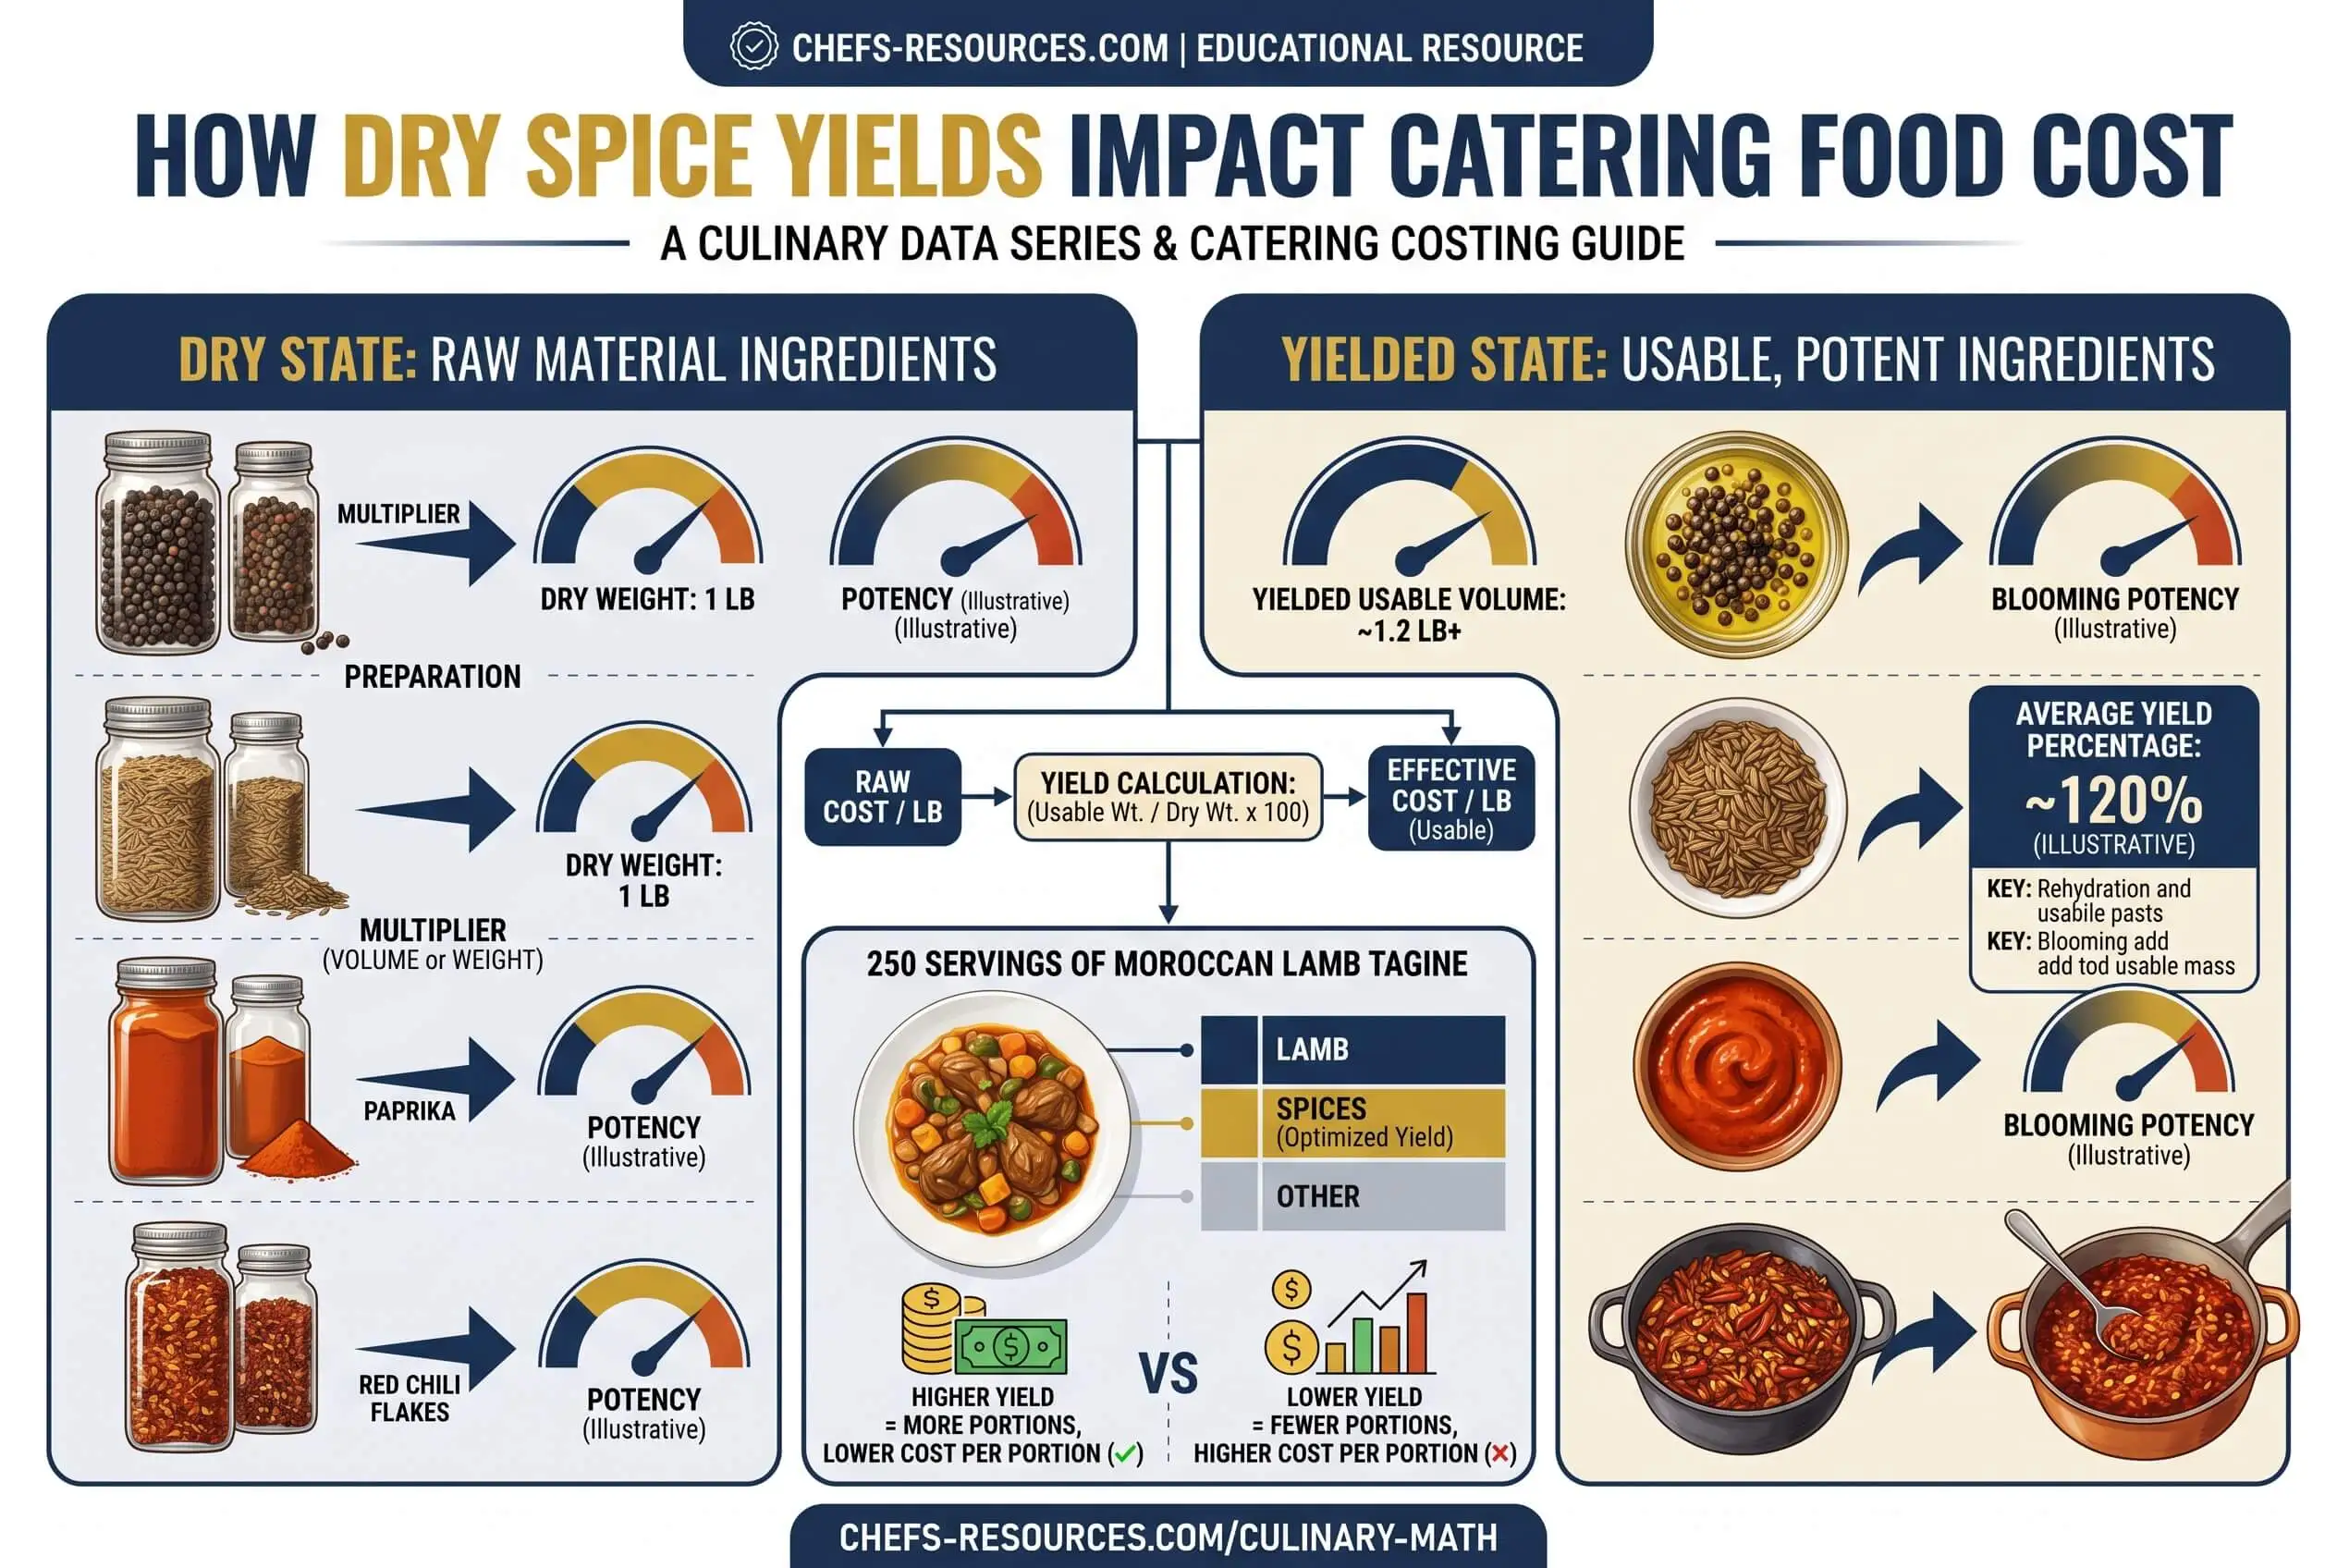
Dry spice yields are the usable seasoning amount you get from a given weight or volume of dried spice, typically expressed as teaspoons per gram, tablespoons per ounce, or ounces per cup. The number varies by spice type, grind size, moisture content, and vendor. Catering kitchens that rely on volume measurement quietly lose food cost margin across high-volume blends as a result.
Key points:
Density ranges across common spices vary by 2.5x. Ground cloves pack near 0.35 tsp per gram. Dried dill weed runs near 0.90 tsp per gram.
Four variables drive yield drift: grind coarseness, moisture content, storage settling, and vendor origin.
Cost impact at scale: a 10% measurement drift on a 14g-per-cover blend at 200 plates costs roughly $34 per event, or about $4,900 per year at typical catering volume.
Weight beats volume. Three cooks measuring "one teaspoon" will produce three different amounts. A precision scale accurate to 0.1g removes the variable.
Re-verify every vendor change. The same spice can shift 10 to 15 percent in density between suppliers with no label change.
Top Takeaways
• The density spread is real. Ground cloves land near 0.35 tsp/g. Dried dill weed lands near 0.90 tsp/g. That’s a 2.5x gap, and it breaks any universal conversion shortcut.
• Four variables cause drift: grind coarseness, moisture content, storage settling, and vendor origin. A supplier swap is the most common unnoticed trigger.
• Margin is built in 1-gram increments. A 10 percent drift on a 200-plate event at 14g per cover runs about $34 per event and roughly $4,900 per year on a single blend at typical catering volume [VERIFY].
• Weight beats volume at scale. Three cooks measuring “one teaspoon” will produce three different amounts. A precision scale removes the variable.
• Re-verify every vendor change. The same spice can shift 10 to 15 percent in density between suppliers [VERIFY] with no label change. Re-measure before the blend hits production.
The problem starts with units. A teaspoon is a fixed volume, a gram is a fixed weight, and how the two relate depends entirely on how tightly a given spice packs into the spoon. That ratio varies a lot more than most caterers expect.
Ground cloves settle heavy, landing near 0.35 teaspoons per gram. Dried dill weed lands near 0.90 tsp/g. Split the difference with a universal conversion factor and you’ll overseason at one end of the rack and underseason at the other. Both produce the same outcome: food your guests don’t finish.
The Four Variables Behind Yield Drift
• Grind coarseness. Finer grinds pack denser. A coarse crack of black pepper weighs less per teaspoon than the table-grind version from the same vendor.
• Moisture content. Fresher spices carry slightly more weight. The same volume from a just-opened tin reads different on the scale than the half-empty tin three months in.
• Settling during storage. Spices compact with time and vibration. A blend transported to an off-premise event and parked in a vehicle for two hours behaves differently than the same blend pulled fresh at the main kitchen.
• Vendor and origin variation. A supplier swap can shift density roughly 10 to 15 percent [VERIFY] with no label change, and that’s the most common unnoticed trigger for a blend that tastes different when nothing else on the line changed.
A full reference sits inside the professional dry spice yields chart from Chefs-Resources, which lists ounces-per-cup and teaspoons-per-ounce figures across more than 100 culinary seasonings. We reach for it whenever we’re re-costing a blend or onboarding a new foodservice vendor.
The Cost Math, Plainly
Work the number for one event. A 200-plate catering dinner plates out at 14 grams of a proprietary house blend per cover, or 2,800 grams total. If the kitchen is scooping instead of weighing and the batch drifts 10 percent heavy, that’s an extra 280 grams of spice. At roughly $0.12 per gram in bulk foodservice pricing [VERIFY], the single event just lost you thirty-four dollars.
Run that across twelve catering events a month and the hit reaches $408. Across a year, it’s close to $4,900. That assumes you never over-drift. Most catering kitchens we’ve audited drift in both directions on different blends, which doesn’t cancel out. It leaves your flavor profile inconsistent while your food cost percentage climbs.
The Four-Step Margin Playbook
• 1. Convert high-volume blends to weight. Anything used in batches larger than one cup gets spec’d in grams. Volume equivalents stay in the recipe as a reference for cooks on stations without scales.
• 2. Standardize scoops and tools across stations. Volume error compounds when three cooks use three different sets of measuring spoons. Specify the exact tools per station and replace them on a schedule, not when they break.
• 3. Cost recipes from weight, not volume. Plate-cost calculations built on teaspoons carry the same drift problem straight into your catering menu pricing. Re-cost against grams and re-issue the number to your proposals team.
• 4. Audit yields on every vendor change. A supplier swap can shift density 10 to 15 percent [VERIFY] with no label change. Weigh a sample cup of the new vendor’s product against your spec before the blend hits production.
“The catering operators who hit their numbers are the ones who weigh what they scoop. We watched a signature rub drift half a point of food cost inside a single catering season because three cooks measured “one tablespoon” three different ways. Nobody caught it until the GM audited the blend at reorder, and by then the menu had already been priced around the wrong number.”
7 Essential Resources
Measuring accurately is half the battle. Costing, tracking, and referencing the right data is the other half. The seven resources below are the ones we reach for first when re-engineering a catering blend or auditing food cost across an event book.
1. Chefs-Resources Dry Spice Yields Chart
The most thorough free conversion reference in the industry. Lists ounces-per-cup, tablespoons-per-ounce, and teaspoons-per-ounce figures across more than 100 spices, including niche seasonings (ajwain, annatto, epazote, sumac) that most charts omit. This is the chart we reach for first when re-costing a proprietary blend or onboarding a new foodservice vendor.
2. USDA FoodData Central
The federal reference database for food composition and portion weights. Search any specific spice and you’ll see gram weights per common measure pulled from verified laboratory sampling. It’s useful when a supplier quote and your own measurement disagree, and the public-domain data plays well inside most recipe management software.
URL: https://fdc.nal.usda.gov/
3. ReFED Restaurants & Foodservice Data Hub
The industry-leading analysis on where foodservice waste actually happens. Plate waste accounts for roughly 70 percent of restaurant and foodservice food waste, which is worth understanding in the context of seasoning consistency because underseasoned or overseasoned food is the food guests leave behind.
URL: https://refed.org/stakeholders/restaurants-and-foodservice/
4. National Restaurant Association — Restaurant Economic Insights
The most current financial benchmarks for food and beverage costs, labor ratios, occupancy, and pre-tax margins across fullservice and limited-service segments. Use it to benchmark your own food cost percentage before you decide how hard to push spice-level efficiencies on a catering book.
URL: https://restaurant.org/research-and-media/research/restaurant-economic-insights/
5. American Weigh Scales GEMINI-20 Precision Milligram Scale
A 0.1-gram-accurate scale at a prep-station price point. Standard kitchen scales round to the gram, which is too coarse for spice measurements in the 1 to 4 gram range. The Gemini-20 is the tool we specify most often when a catering kitchen commits to weight-based seasoning discipline.
URL: https://awscales.com/gemini-20-precision-milligram-scale/
6. Institute of Culinary Education — Organizing and Using Spices
A professional-grade primer on spice blending ratios, storage practices, and inventory. The piece reinforces why weight-based discipline matters once you’re building custom blends, where base, accent, and heat ratios compound small measurement errors across every batch produced.
URL: https://www.ice.edu/blog/best-way-to-organize-spices
7. Recipe Cost Calculator
A straightforward web tool for calculating per-portion cost using ingredient weights. Feed it the gram weight of your blend and the per-pound purchase price, and it outputs plate cost without the manual math. We use it for fast validation of catering menu pricing before a proposal goes out the door.
URL: https://recipecostcalculator.net/
3 Statistics
The case for weight-based spice measurement isn’t ideological. It’s a reading of published industry data that lines up with what every catering operator already knows intuitively.
31% of the U.S. Food Supply Goes Uneaten
According to USDA Economic Research Service analysis, roughly 133 billion pounds of food went uneaten at the retail and consumer levels in 2010, with an estimated retail value of $162 billion. That makes consistency even more important for operations built around farm fresh food, where accurate yield assumptions help protect quality, reduce overproduction, and support a more efficient, positive service outcome.
Source: USDA Economic Research Service, Food Availability (Per Capita) Data System — Food Loss
URL: https://www.ers.usda.gov/data-products/food-availability-per-capita-data-system/food-loss
~70% of Restaurant & Foodservice Food Waste Is Plate Waste
ReFED attributes nearly 70 percent of restaurant and foodservice food waste to food that was served but not eaten. Inconsistent seasoning (food that tastes dull, off-balance, or simply different from what the kitchen intended) is a documented contributor. Weight-based spice discipline is one of the cheaper levers a caterer has to move this number.
Source: ReFED — Restaurants and Foodservice
URL: https://refed.org/stakeholders/restaurants-and-foodservice/
Food & Beverage Costs Run a Median 32% of Sales
According to the National Restaurant Association’s 2025 Restaurant Operations Data Abstract, food and non-alcohol beverage costs landed at a median of 32.0 percent of sales for full-service operators in 2024. That leaves pre-tax profit margins near 5 percent for the typical operation. A single point of food cost can represent close to a fifth of annual profit on a thin-margin catering book.
Source: National Restaurant Association, Restaurant Operations Data Abstract (2024 data, 2025 release)
Final Thoughts and Opinion
Dry spice yields aren’t glamorous. They sit in the middle of a line cook’s prep list next to three dozen more urgent things. After enough years watching catering margins erode in ways nobody can trace, we’ve come to treat yield discipline as foundational. Less exciting than menu design, more important than most GMs realize.
Our take is plain: weight wins. Every catering kitchen that moves its high-volume blends to gram measurement recovers margin inside the first quarter. The reason has nothing to do with any one cook being better or worse than another. A teaspoon stops being a teaspoon the moment three people on two shifts use four different scoops. Weight takes that variable off the table.
There’s a secondary argument about flavor. A signature blend that drifts 10 percent across the year is no longer the blend you launched with. Guests notice. Not by calling it out, but by leaving food on the plate and not rebooking. In our view, yield discipline is one of the most underrated flavor-consistency tools in catering.
If you do one thing after reading this, make it this: pull your highest-volume catering menu item, convert its spice specs to grams, and run it against last quarter’s cost recipe. The delta will tell you exactly how much money dry spice yields have been pulling out of your margin without your knowledge.
Frequently Asked Questions
What is a dry spice yield?
A dry spice yield is the usable amount you get from a given quantity of dried seasoning. It’s typically expressed as teaspoons per gram, tablespoons per ounce, or ounces per cup. Yield is how a caterer translates between a purchase specification (usually by weight) and a recipe specification (often by volume), and the number varies meaningfully depending on spice type, grind size, and vendor.
How do dry spice yields affect catering food cost percentage?
Inaccurate yields push food cost in two directions at once. Overseasoned batches use more spice than the recipe was cost for, which raises food cost directly. Underseasoned batches produce food that guests don’t finish, which shows up as plate waste and lost repeat bookings. On a thin-margin catering book, a single point of food cost can represent close to a fifth of annual profit.
Why can’t I use one conversion rate for all ground spices?
Density varies too much. Ground cloves pack near 0.35 tsp/g. Dried dill weed runs near 0.90 tsp/g. That’s a 2.5x spread between the densest and lightest common seasonings. A single conversion factor will undercount one and overcount the other. When you’re building blends with three or four components, those errors compound.
Should caterers measure spices by weight or by volume?
Weight. Volume measurement introduces cook-to-cook variability that compounds across shifts and events. For any blend used in batches larger than a cup, specify grams with volume equivalents listed only for reference. Small-batch tasting portions can stay on volume. Production quantities shouldn’t.
How often should I re-test my dry spice yields?
Re-verify on every vendor change, on every grind-size change, and at least quarterly on proprietary blends. Storage and settling alone can shift the density of an open container by the time you’re halfway through it. A quick weigh-back before a big catering event is cheap insurance against a cost recipe drifting out from under you.
Lower Your Catering Food Cost This Quarter
Pick one proprietary blend. Weigh it on a precision scale, then re-cost a single catering menu item against the corrected yield. If the number shifts by more than a point of food cost, you’ve found your leak, and every future event runs cleaner from that day forward.
The compounding effect matters. One blend audited this week turns into three audited next month. By next quarter you have a catering book that costs exactly what you priced it to cost. Margin rebuilds itself in 1-gram increments.
Keep reading on Farm Fresh Groceries:
• Converting Small Recipe Spice Amounts to Bulk Production — A Yield Guide
• How To Adapt The Traditional Brigade System In a 5-Person Home Kitchen or Startup Bistro
• Selecting The Best Produce Grocery Subscription Boxes For Farm-Direct Produce
Share your own spice-yield audit results in the comments below. The more catering data the culinary desk collects, the sharper the guidance gets for the operators who read next.


