TL;DR Quick Answers
excel recipe inventory template
An Excel recipe inventory template is one workbook doing two jobs. It costs every dish you make, and it tracks the ingredients on hand to make them. The strongest templates connect both halves through one ingredient ID column, so a single price update recalculates every recipe using that ingredient. For a ready-built starting point, the Excel recipe template with inventory from Chefs Resources pairs standardized recipe cards with on-hand stock counts in one file. It works for operators, caterers, culinary students, cottage food producers, and home cooks who want to stop guessing what dinner actually cost.
Top Takeaways
An Excel recipe inventory template tracks two halves: recipe cards with ingredient quantities and plate cost, and an inventory ledger with on-hand counts, unit cost, and par levels.
The two halves should share one ingredient ID column, so a single price update flows everywhere automatically.
A standardized recipe is the foundation for accurate costing, because every ingredient quantity, cooking method, and yield is fixed before the math starts.
Yield-adjusted cost matters more than purchase cost. Trim, bone, and cook loss can cut usable weight by thirty percent or more, and the recipe card has to reflect what actually plates.
Update ingredient prices on a fixed cadence: weekly for operators, monthly for home cooks. Recount inventory on the same schedule. Stale data turns a good workbook into a misleading one.
What an Excel Recipe Inventory Template Actually Tracks
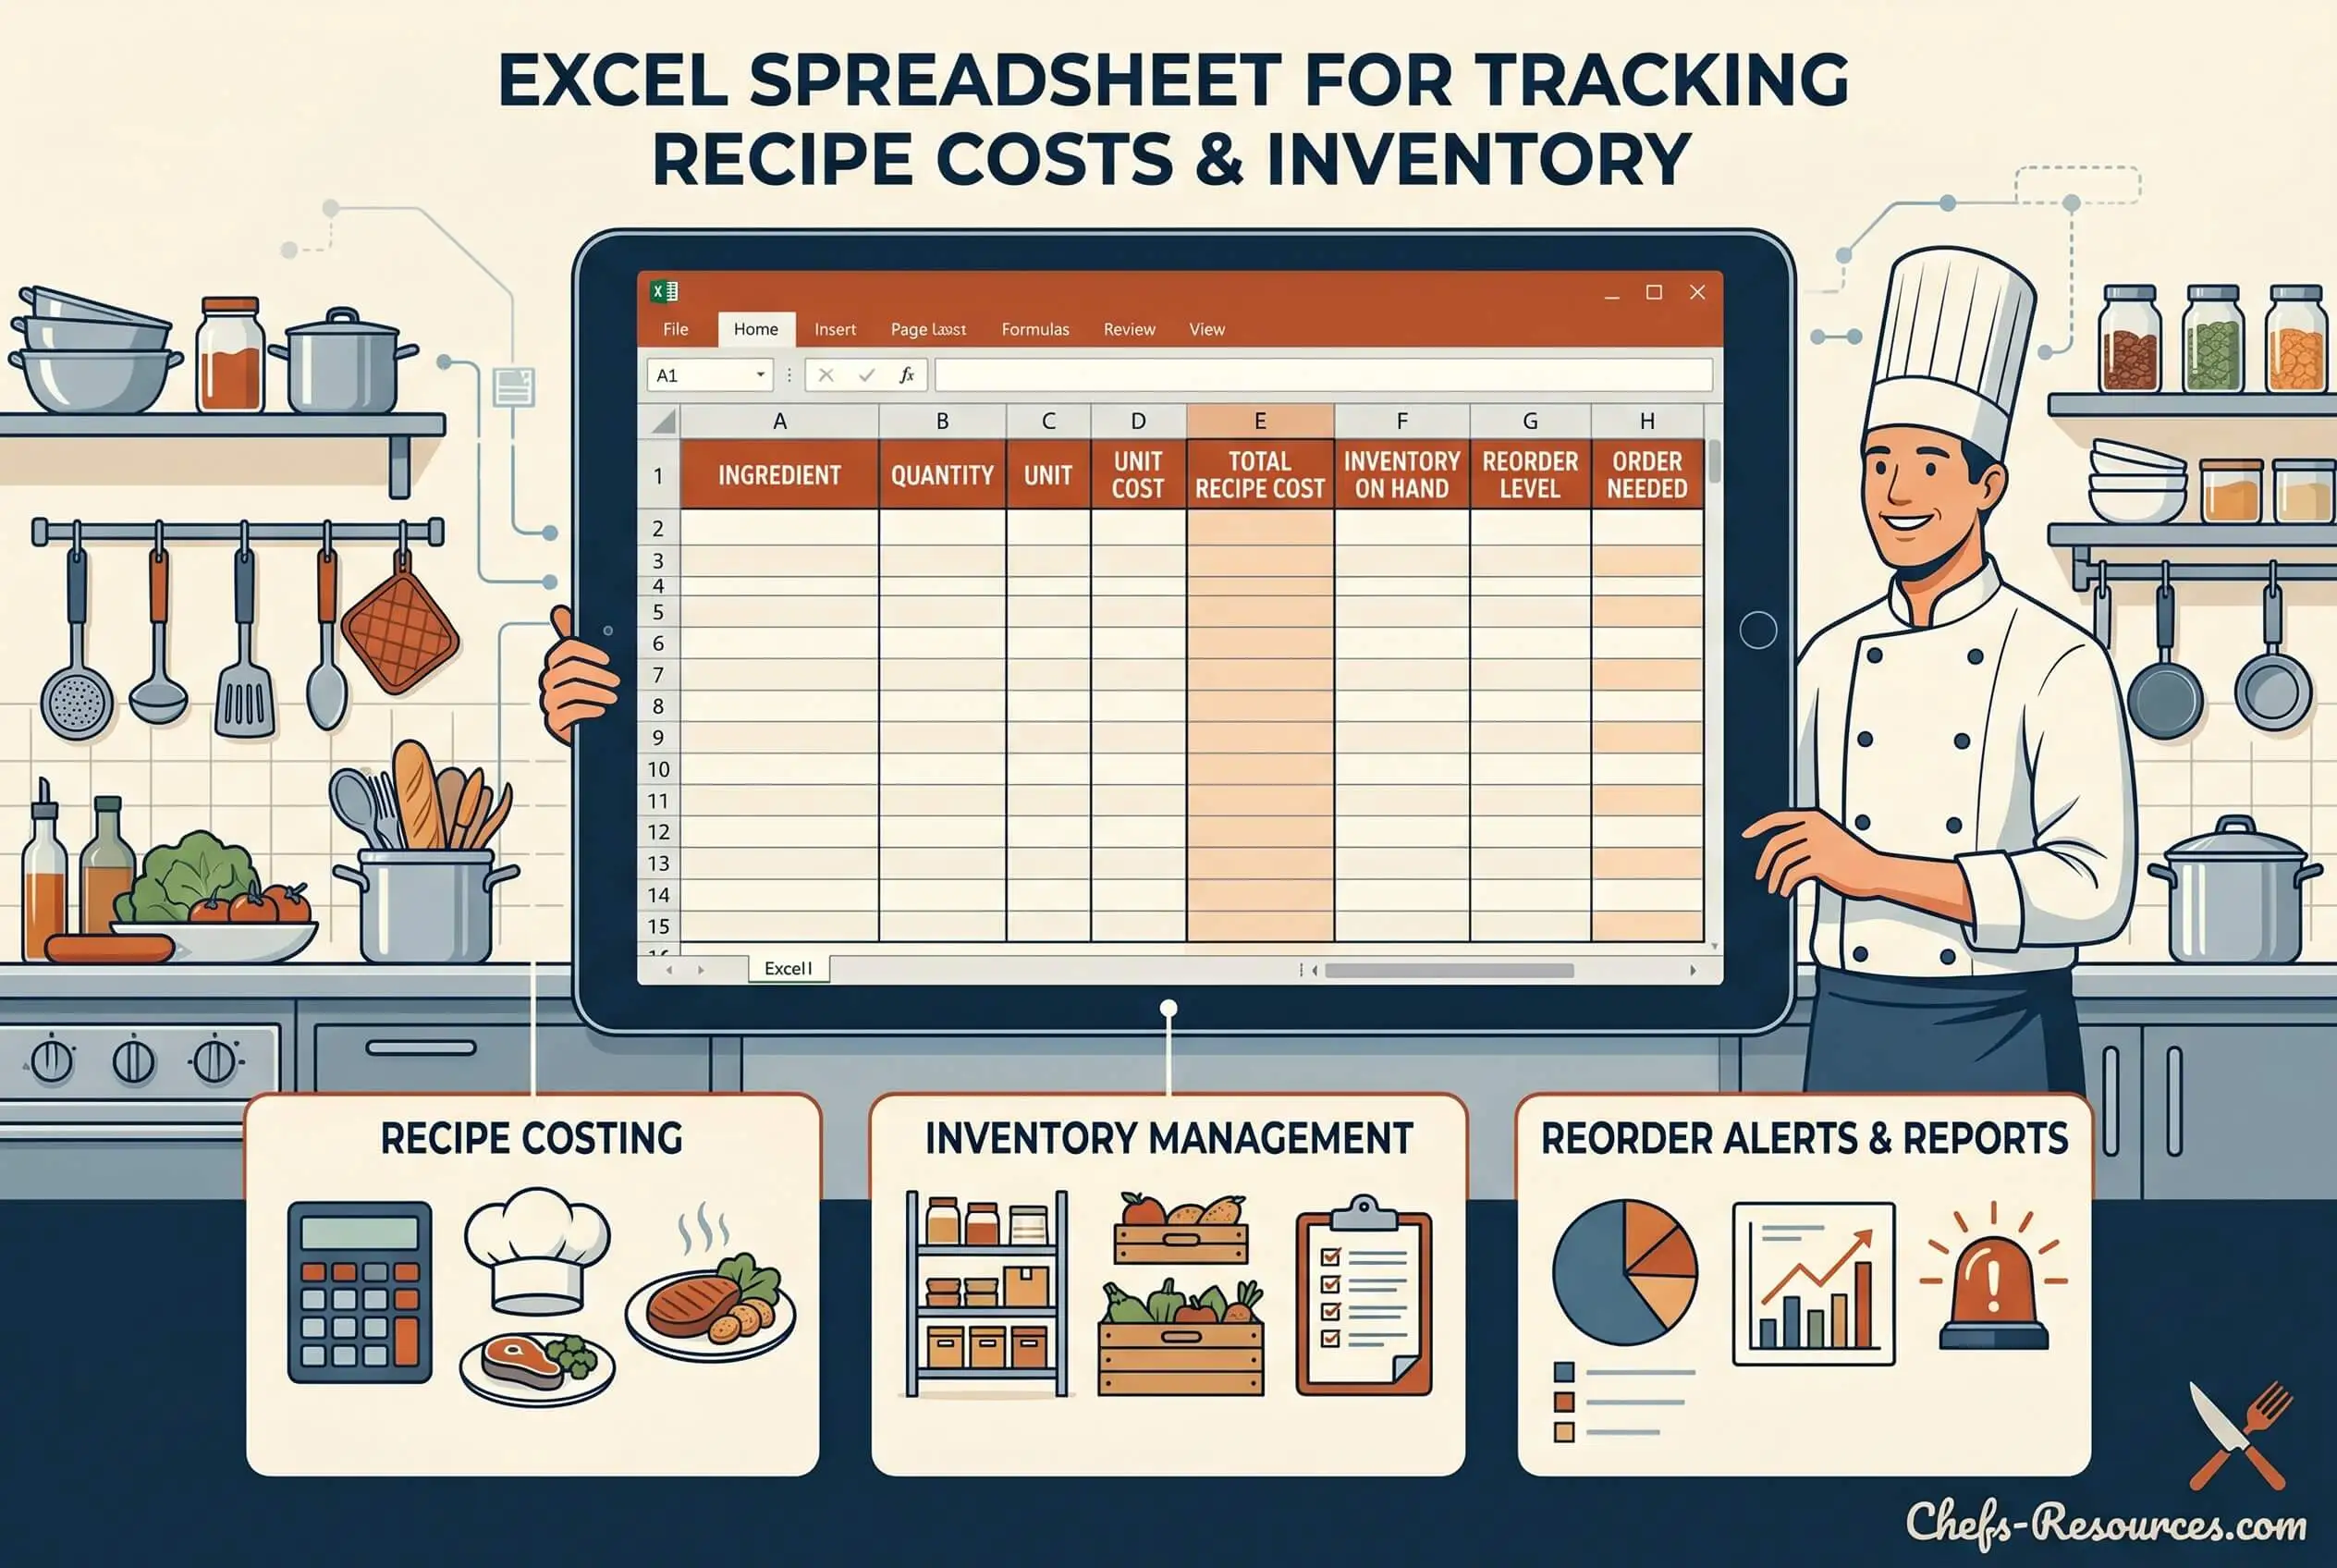
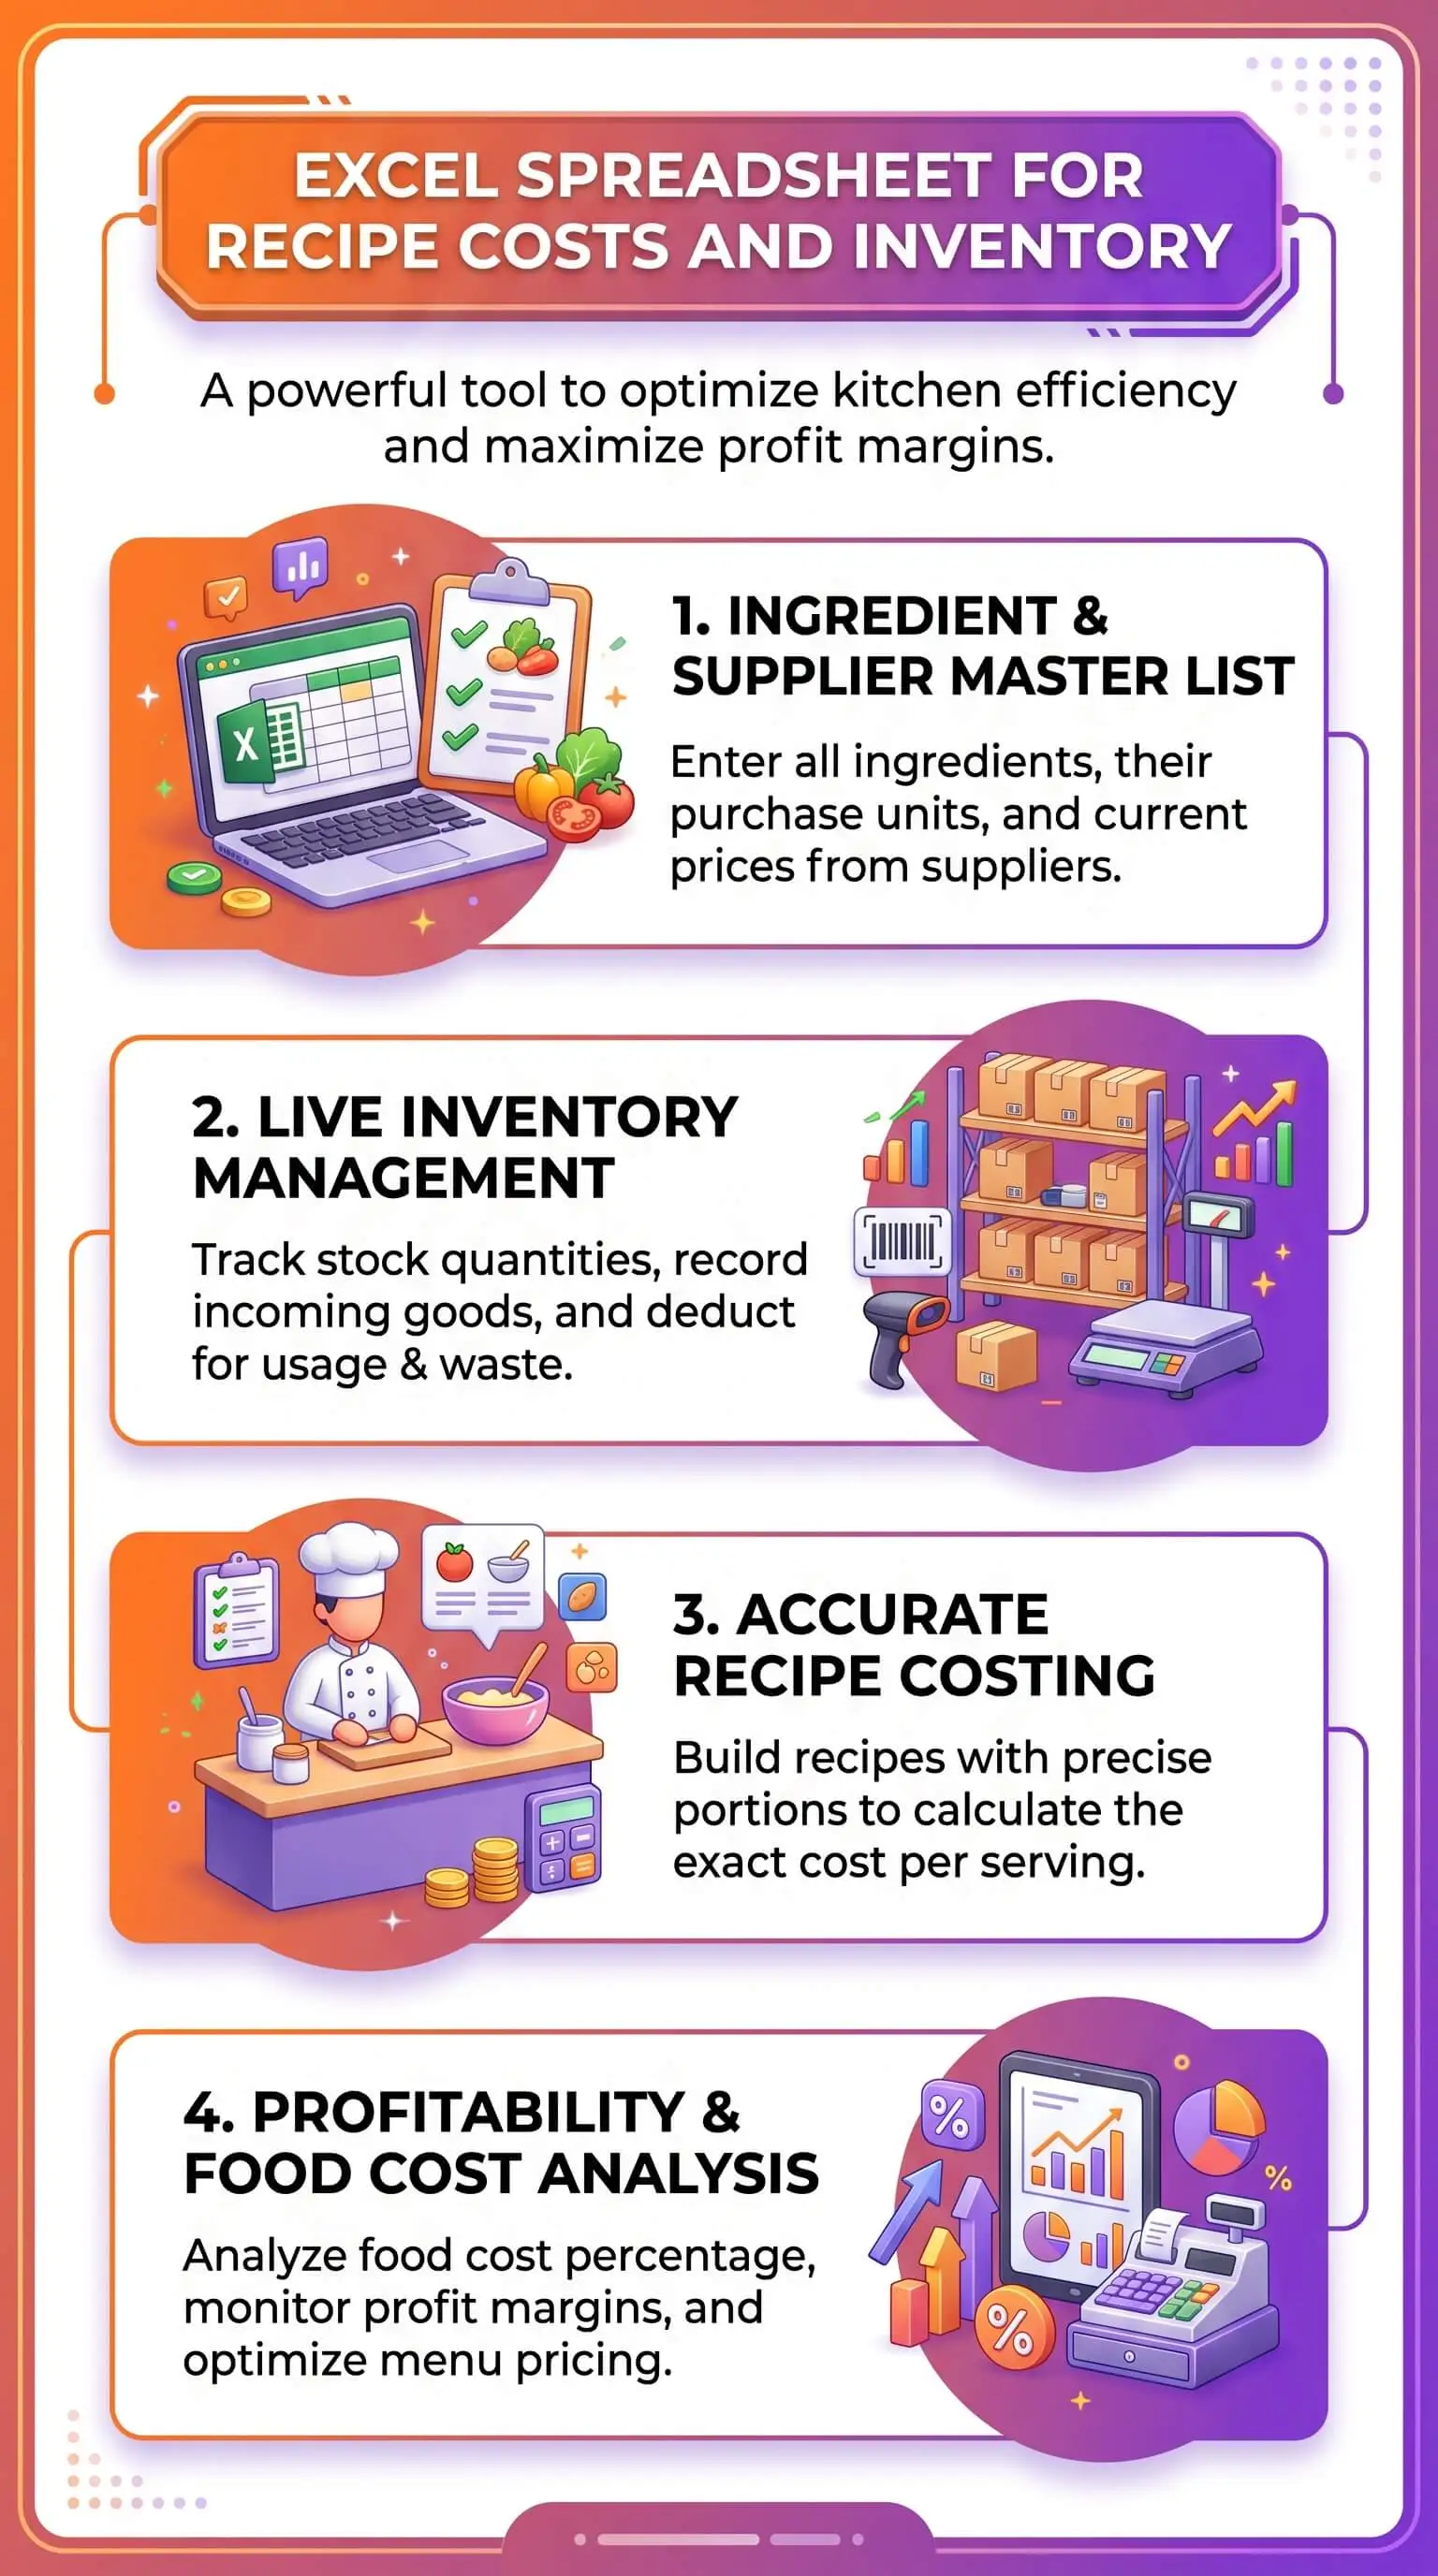
A working template has two halves that talk to each other. The first is a set of recipe cards, one per dish, holding ingredient quantities, yield, plate cost, menu price, and food cost percentage. The second is an inventory ledger with on-hand quantities, unit cost, par levels, last-counted dates, and ingredient ID. One ingredient ID column ties both halves together. Update the price of olive oil once in the ledger, and every recipe using olive oil recalculates on its own. No copy-paste, no version drift, no half-spreadsheet running on last quarter's numbers.
In Excel, the mechanics are simple. XLOOKUP or VLOOKUP pulls ingredient data into the recipe card, and SUMIF totals the batch cost. Anyone who can edit a cell can run this template, provided they commit to one habit: updating prices when invoices land.
Who Benefits Most From a Combined Recipe and Inventory Tracker
Operators and caterers reach for it first. They use the workbook to hold food cost percentage inside a target band and to catch the variance between theoretical and actual usage—the gap where shrinkage hides. Home cooks and meal preppers run it differently. They plan a weekly grocery shop that matches the meals already on the calendar, instead of throwing produce out on Sunday because nothing got used. Culinary students learn standardized recipe writing and plate costing on a tool they can carry into their first working kitchen. The small-batch crowd, jam makers and bread bakers and prepared-foods vendors operating out of cottage food kitchens, sets wholesale and retail prices that hold up against rising ingredient costs.
Eight Columns Every Recipe Card Should Include
Here are the eight columns the recipe card needs, in order:
Ingredient name. Write it exactly as it appears in the inventory ledger so the lookup formula resolves cleanly.
Ingredient ID or SKU. The lookup key that connects the recipe card to the inventory ledger.
Purchase unit and purchase price. What you actually pay at the supplier or grocery store, per case, per pound, or per gallon.
Recipe unit and conversion factor. The unit you'll cook with (ounces, cups, grams) and the math that converts purchase to recipe.
Quantity used per batch. The amount the recipe calls for, in recipe units.
Extended cost per ingredient. Quantity multiplied by recipe unit cost.
Total batch cost. The sum of all extended costs for the dish.
Cost per serving or per plate. Total batch cost divided by yield.
Five Inventory Fields That Prevent Waste and Stockouts
The inventory side stays useful only when every ingredient row carries these five fields:
On-hand quantity. Updated weekly or whenever a delivery hits the dock.
Par level. The minimum quantity to keep on hand, based on consumption velocity.
Reorder point. The trigger to place an order before you run out.
Last-counted date. The timestamp on your most recent physical count.
Shrink or waste flag. A simple column that flags items lost to spoilage, trim, or theft.
Perishables pay the highest dividend on tight par-level discipline. Produce especially: there's a short window between peak quality and the compost bin, and a par level set even one case too high costs money every week.
Three Common Mistakes That Make Recipe Costing Inaccurate
Three errors show up in spreadsheet after spreadsheet, year after year, kitchen after kitchen.
The first is using purchase price instead of yield-adjusted cost. A case of bone-in chicken thighs costs less per pound than boneless skinless, but once you trim and bone them, the usable yield can drop by thirty percent or more. The recipe card has to use the as-used cost, the weight that actually plates, not what came off the truck.
The second is forgetting to update ingredient prices when invoices change. Olive oil that ran twenty-two dollars a gallon in spring can run twenty-nine by fall. Recipes built on outdated prices undercharge customers and erode margin month after month, often without anyone noticing until the quarter closes.
The third is ignoring labor and packaging when pricing for sale. A jar of peach jam priced at the cost of fruit, sugar, and pectin alone leaves the maker working for free. Build labor into the finished-goods cost at a fair hourly rate, and account for the jar, lid, label, and shipping. Skip those line items and every sale chips away at the bank account instead of building it.
“A recipe inventory template earns its keep when the costing math and the stock counts share one source of truth. The moment they diverge—and we've watched this happen in dozens of kitchens—you stop trusting the file and you stop using it. Build the workbook so one ingredient ID drives both halves, and the spreadsheet becomes the quiet, reliable backbone behind every menu decision. “
Essential Resources
Pair the template with these external resources for accurate costing, regulatory clarity, and farm-direct sourcing:
USDA FoodData Central. Nutrient and ingredient yield data for accurate per-portion costing.
National Restaurant Association. Industry research and food cost benchmarks built for operators.
Culinary Institute of America. Standardized recipe writing standards and culinary education from a top-tier school.
Microsoft Create Templates. Free Excel template gallery for recipe and inventory starting points.
Bureau of Labor Statistics CPI for Food. Official tracking of food price changes—the signal for when to reprice the menu.
FDA How to Start a Food Business. Regulatory overview for cottage food operators and small-batch producers.
LocalHarvest CSA Directory. Search tool for community supported agriculture shares and farm-direct sourcing.
Supporting Statistics
Three numbers that drive home why the discipline pays off:
Roughly one third of all food produced for human consumption gets lost or wasted globally every year, equivalent to about 1.3 billion tonnes, according to the Food and Agriculture Organization of the United Nations.
Food waste in the United States runs between 30 and 40 percent of the food supply, based on USDA Economic Research Service figures for retail and consumer-level loss.
A healthy restaurant food cost percentage typically lands between 28 and 35 percent of revenue, per industry benchmarks reported by Toast.
Different scales, same lesson: tight, consistent tracking beats after-the-fact accounting every time.
Final Thoughts
The best recipe inventory template is the one you actually open. Macros and dashboards are tempting, but the file that earns its keep is the one opened Monday morning, refreshed with last week's invoice prices, reconciled against a physical count, and trusted on Tuesday by whoever's running the order sheet. Start simple. Get the ingredient ID column right, get the yield conversion right, and update prices on a schedule you'll actually keep. Refine as the menu grows, not before.
We've watched home cooks save hundreds of dollars a year on grocery waste with nothing more than a clean Excel workbook and a Sunday-night pantry count. We've watched line kitchens cut three to five points of food cost in ninety days by doing the same thing on a tighter schedule. The tool isn't doing the work. You are. The spreadsheet just makes sure you can see what's happening before the P&L tells you it's too late.
Frequently Asked Questions
How do I calculate the cost per serving of a recipe in Excel?
Multiply each ingredient's recipe-unit cost by the quantity used per batch. That gives you the extended cost per ingredient. Sum the extended costs for total batch cost, then divide by yield (the number of servings) to get cost per serving. SUMIF handles the totals cleanly, and rounding to the nearest cent is plenty of precision for menu pricing.
What is the best free Excel template for recipe costing and inventory?
The best template is the one that links a single ingredient ID across both recipe cards and the inventory ledger. Free options vary in quality. Look for an XLOOKUP or VLOOKUP architecture, a clear yield conversion column, editable par levels, and unprotected formulas you can adapt as the menu grows.
How often should I update ingredient prices in my recipe spreadsheet?
Restaurant operators should update weekly, or whenever invoices arrive. Home cooks can update monthly. Cottage food producers should reprice every quarter at minimum, and immediately after any major supplier change. Outdated prices erode margin silently and lead to undercharging by the time anyone notices.
Can a single Excel file handle both home meal planning and small catering jobs?
Yes, if the file is built around an ingredient ID system. The same recipe card scales from a four-person dinner to a forty-person catering tray, as long as the yield conversion is honest and the batch quantities scale linearly. Add a column for event date and headcount when you scale up.
What is the difference between recipe costing and food cost percentage?
Recipe costing is the dollar cost of making one dish. Food cost percentage is the share of menu price that cost represents. A dish costing four dollars and selling for fourteen runs a 28.6 percent food cost, which sits inside the healthy band most operators target.
Get Farm-Fresh Ingredients Worth Tracking
Bring the same care to your ingredients that you bring to your spreadsheet. The math only works when the produce, dairy, and pantry staples lined up on your counter are worth tracking. Explore the farm fresh food sourcing guides for seasonal produce picks, local farm directories, and ingredient-quality tips that make every line on your recipe card pay you back.


